Linear models: a classic example#
import pandas as pd
import numpy as np
from sklearn.linear_model import LinearRegression
import matplotlib.pyplot as plt
dat = pd.read_csv("https://raw.githubusercontent.com/bcaffo/ds4bme_intro/master/data/swiss.csv")
dat.head()
| Region | Fertility | Agriculture | Examination | Education | Catholic | Infant.Mortality | |
|---|---|---|---|---|---|---|---|
| 0 | Courtelary | 80.2 | 17.0 | 15 | 12 | 9.96 | 22.2 |
| 1 | Delemont | 83.1 | 45.1 | 6 | 9 | 84.84 | 22.2 |
| 2 | Franches-Mnt | 92.5 | 39.7 | 5 | 5 | 93.40 | 20.2 |
| 3 | Moutier | 85.8 | 36.5 | 12 | 7 | 33.77 | 20.3 |
| 4 | Neuveville | 76.9 | 43.5 | 17 | 15 | 5.16 | 20.6 |
y = dat.Fertility
x = dat.drop(['Region', 'Fertility'], axis=1)
fit = LinearRegression().fit(x, y)
yhat = fit.predict(x)
[fit.intercept_, fit.coef_]
[66.9151816789687,
 array([-0.17211397, -0.25800824, -0.87094006,  0.10411533,  1.07704814])]
x2 = x
x2['Test'] = x2.Agriculture + x2.Examination
fit2 = LinearRegression().fit(x2, y)
yhat2 = fit2.predict(x2)
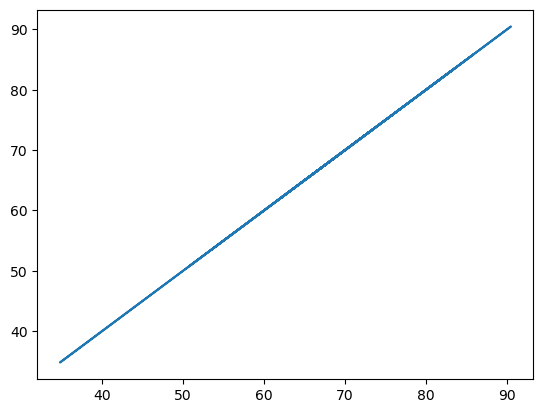
plt.plot(yhat, yhat2);

x3 = x2.drop(['Agriculture'], axis = 1)
fit3 = LinearRegression().fit(x3, y)
yhat3 = fit3.predict(x3)
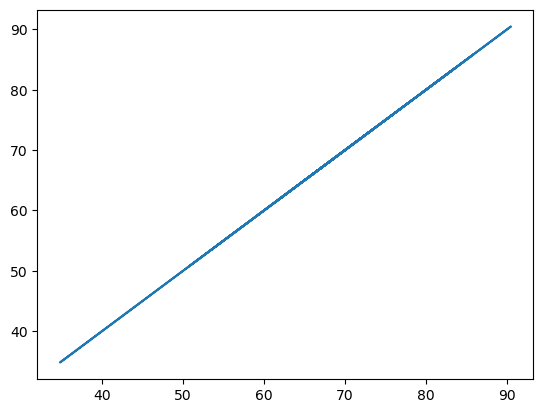
plt.plot(yhat, yhat3);

